آخر المواضيع المضافة

 تاريخ الرياضيات
الرياضيات في الحضارات المختلفة
الرياضيات المتقطعة
الجبر
الهندسة
المعادلات التفاضلية و التكاملية
التحليل
علماء الرياضيات
تاريخ الرياضيات
الرياضيات في الحضارات المختلفة
الرياضيات المتقطعة
الجبر
الهندسة
المعادلات التفاضلية و التكاملية
التحليل
علماء الرياضيات | Chi-Squared Test |


|
|
Read More
Date: 9-3-2021
Date: 18-2-2021
Date: 15-2-2016
|
Let the probabilities of various classes in a distribution be  ,
,  , ...,
  , with observed frequencies
  ,
,  , ...,
  . The quantity
 |
(1) |
is therefore a measure of the deviation of a sample from expectation, where  is the sample size. Karl Pearson proved that the limiting distribution of
  is a chi-squared distribution (Kenney and Keeping 1951, pp. 114-116).
The probability that the distribution assumes a value of  greater than the measured value
  is then given by
 |
 |
 |
(2) |
 |
 |
 |
(3) |
 |
 |
 |
(4) |
There are some subtleties involved in using the  test to fit curves (Kenney and Keeping 1951, pp. 118-119). When fitting a one-parameter solution using
  , the best-fit parameter value can be found by calculating
  at three points, plotting against the parameter values of these points, then finding the minimum of a parabola fit through the points (Cuzzi 1972, pp. 162-168).
REFERENCES:
Cuzzi, J. The Subsurface Nature of Mercury and Mars from Thermal Microwave Emission. Ph.D. Thesis. Pasadena, CA: California Institute of Technology, 1972.
Kenney, J. F. and Keeping, E. S. Mathematics of Statistics, Pt. 2, 2nd ed. Princeton, NJ: Van Nostrand, 1951.


|
|
|
|
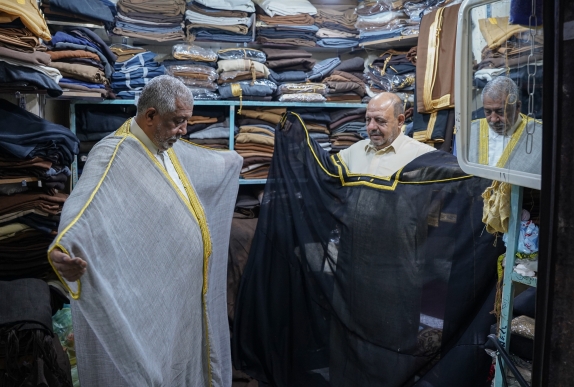
التوتر والسرطان.. علماء يحذرون من "صلة خطيرة"
|
|
|
|
|
|
|
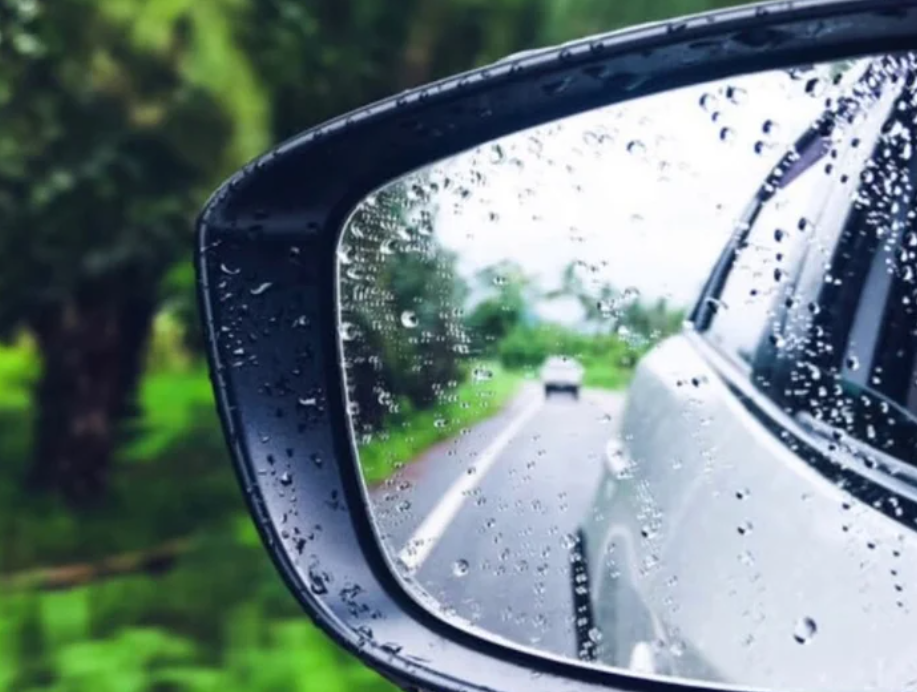
مرآة السيارة: مدى دقة عكسها للصورة الصحيحة
|
|
|
|
|
|
|
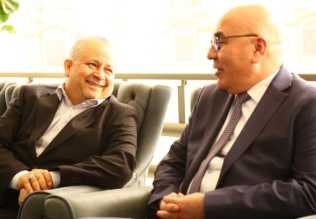
نحو شراكة وطنية متكاملة.. الأمين العام للعتبة الحسينية يبحث مع وكيل وزارة الخارجية آفاق التعاون المؤسسي
|
|
|